CLO resilience amidst volatile markets
16-Apr-25Busting the CLO CCC myth
02-Jun-25CLO resilience amidst volatile markets
16-Apr-25Busting the CLO CCC myth
02-Jun-25Insights
Correcting CCC confusion

Barry Povey
Principal
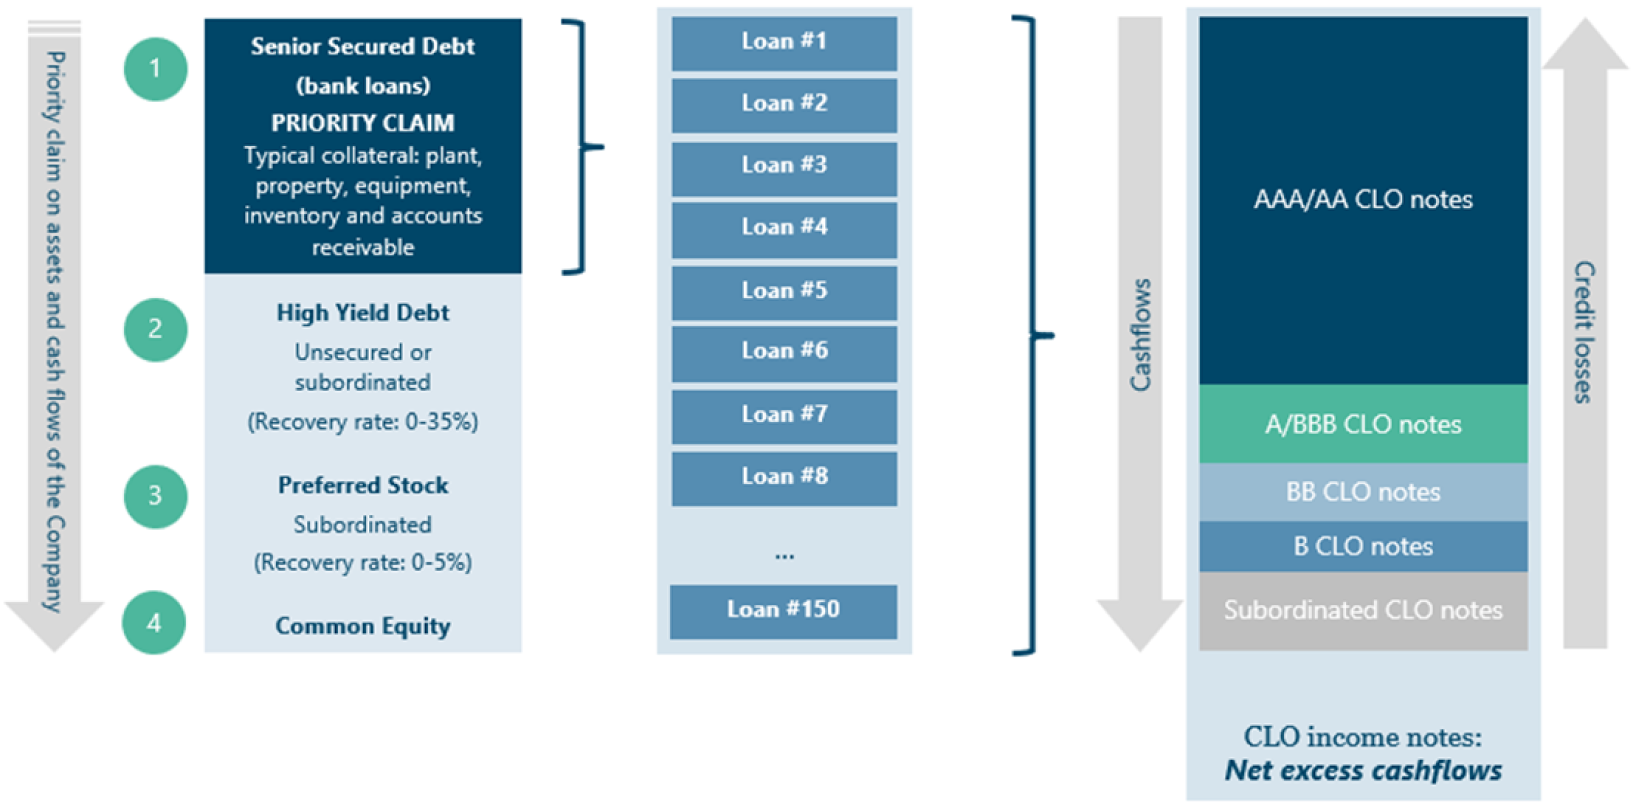
Understanding the impact of CCC assets on CLOs
Given the complexity of this topic, the impact of loan downgrades within a CLO’s portfolio can create confusion for investors. Articles in the media often cite the dangers for CLO debt investors of growing CCC balances in portfolios, that could result in forced selling of CCC assets at distressed levels.
We delve into some of these topics to clarify the implications for CLOs should CCC balances rise and dispel this common myth.
We will explain how the CCC limit in CLOs is not a forced liquidation trigger but rather one of several pre-emptive features which offer protection to CLO note holders. These features have contributed to robust credit performance observed through multiple market cycles over the last 25 years.
How CLOs are structured to be resilient to market volatility
A large advantage of CLO portfolios is their ability to avoid exposure to market volatility given their non-mark-to-market structures. No AAA-rated CLO has ever defaulted in over 25 years (when rating agency data first started being collected).1 This is a track record that covers the Asian Financial Crisis (1997), Russian default (1998), Dot-com bubble (2000-2002), Global Financial Crisis (2007-2008), Eurozone crisis (2009-2012), and COVID (2020).
CLOs have maintained this record in part through the numerous tests built into the structure. This ensures that CLOs operate as designed, with sufficient loan collateral to protect investors throughout the lifecycle of the deal. CLO debt notes are structured to be over-collateralised. That is to say there are more assets (underlying loans) backing their investment than is owed on that investment. This is a common feature of many debt structures, such as residential mortgages, in which the total amount the bank lends is lower than the property’s value, providing the bank with a cushion should the value of the property decline. A typical CLO deal may have €225m AAA debt but €375m assets backing them. This provides a cushion to the AAA investor – the assets could experience €150m of losses before they are worth less than the amount owed on the AAA-rated CLO debt.
The benefit of over-collateralisation

The structural tests maintained by CLOs
To consistently measure this ‘over-collateralisation’, each CLO specifies a series of tests, all working in a similar way. The calculation involves taking the total amount of assets in the deal (the underlying loans) and divide it by the CLO debt (e.g. the AAA tranche). This is known as the over-collateralisation ratio (OC ratio). In the above example, the OC ratio would be 167% (€375m / €225m). This number is then compared to a predetermined limit every month (e.g. 127%) to determine whether the OC test is in compliance.
If the OC ratio is above this limit, the OC test passes and cash flows through the payment waterfall. If it is below the limit, then cash flows that would have been paid to the equity of the CLO get redirected to increase the ratio back to an acceptable level. This can be achieved by decreasing the denominator (paying back the AAA investor) or in some cases buying more assets (increasing the numerator). This mechanism helps keep a CLO investor’s exposure lower than the total amount of assets in the deal. Importantly, there is no forced selling required in this process – the structure automatically redirects cashflows, which would have been distributed to the equity tranche, to the AAA investors.
A key consideration is how to calculate the amount of underlying loan assets in a deal. There are two potential methods –
- ‘Par value’: Sum the total amount borrowed on each loan.
- Current market value: Sum the market price investors would currently pay for each loan.
CLOs use method 1 (par value) – this is what is meant by ‘non-mark-to-market’.
The total amount of loans will not change as market prices move up and down, which creates more predictability in the test levels. That’s not to say market values are not informative – many CLO investors consider the total market value of the loans at any time when making a CLO investment. However, as CLOs use method 1 for calculating tests, this allows the CLO to function predictably throughout volatile periods.
A simplified CLO payment waterfall

How asset risk is incorporated into CLO tests
So far, we have established that the OC test serves as a safeguard to ensure that the value of the underlying loan portfolio remains sufficient to cover the outstanding debt throughout the life of a CLO. While it is true that using the par value of loans for calculating the OC ratio is sensible for preventing erratic test results, it may not be appropriate if the CLO’s loan portfolio includes an elevated number of loans with a lower likelihood of being repaid at par.
To address this, CLO structures incorporate provisions to account for credit migration, particularly for loans rated CCC or lower. The "CCC haircut" mechanism ensures that when a CLO portfolio has a material concentration of CCC-rated assets, those loans are no longer all valued at par in OC calculations. Instead, a portion of these CCC loans is valued at prevailing market prices to reflect potential impairments. In this way, the CLO structure is taking pre-emptive provisions given the fundamental quality of certain assets may have deteriorated.
To haircut or not to haircut? – calculating the CCC haircut
Each month, the CLO trustee aggregates the par amount of all CCC-rated loans within the portfolio. If the total par amount of CCC loans does not exceed 7.5% of the overall loan portfolio, the OC ratio continues to be calculated using the par values for all assets. However, once the CCC concentration surpasses this 7.5% threshold, the treatment changes. For any CCC loans above the threshold, the trustee includes them in OC calculations at their market value rather than their par value. Importantly, this is only for the CCC loans in excess of the threshold, of which the lowest-priced CCC assets are selected. This prevents selective pricing and ensures the most conservative outcome – a process commonly referred to as the “CCC haircut.”
To illustrate this mechanism, consider a CLO with €375 million in total assets and €350.6 million in rated debt. The OC test which is most likely to fail first if CCC’s increase would be the reinvestment over-collateralisation test. This OC ratio takes the total assets in the CLO divided by all the rated debt (as opposed to just the AAA tranche), resulting in a ratio of 107%, providing a 4% cushion above a typical test threshold of 103%.
Assuming that 10% of the portfolio comprises of CCC loans, each trading at 50% of par, the deal would be haircut to €370m total assets (rather than €375m). This would be comprised of:
- €337.5m non-CCC loans counted at par (90% of €375m)
- €28.1m of CCC assets counted at par (7.5% of €375m)
- €4.7m of CCC assets above 7.5% counted at market value (2.5% of €375m at 50% of face value)
Determining asset value for OC tests

This adjustment would reduce the OC ratio to approximately 105.6% (from 107%) and result in a cushion of 2.6% (from 4%) above the limit. Further increases in CCC loan concentrations or additional price deterioration could reduce this cushion further and potentially trigger a test failure. Should the reinvestment OC ratio fall below its threshold, the CLO would be required to divert subordinated noteholder (equity) distributions until compliance is restored above 103% – typically by repaying senior noteholders or purchasing additional performing collateral.
Modelling the sensitivity of CLOs to CCC risk
An important consideration for CLO investors is determining the level of CCC-rated loan concentration that would cause an OC test to fail. The chart below illustrates how the OC cushion declines as the proportion of CCC assets increases. While the 7.5% threshold is the point at which market value haircuts begin to apply, it does not typically result in an immediate test failure. In this example, a breach of the reinvestment OC test does not occur until the CCC balance reaches approximately 15% of the portfolio.2
It is important to note that while 7.5% is the pre-emptive provision which starts causing the test cushion to decline, the actual level at which the cushion turns negative (causing the test to breach and cashflow diversion) depends on the specific structure and asset composition of each CLO.
Sensitivity to CCC risk
Assuming CCC assets priced at 50c

Conclusion
- Over-collateralisation: This feature helps to provide CLO debt investors with structural protection and is maintained throughout the CLO’s lifecycle through a series of ‘OC’ tests.
- Non-mark-to-market: The OC test is measured using the par value of performing assets. This helps to insulate CLOs against market gyrations and provide investors with stability during periods of wider volatility.
- 7.5% CCC provision: Rather than a hard limit, the 7.5% CCC threshold is the percentage at which the OC test cushions will start decreasing in a deal, but will not cause the forced selling of loans.
- Cashflow diversion: 7.5% does not represent the CCC threshold at which cashflows will begin to divert either. In the example above (of a typical recent structure), the CCC balance must be in excess of 15% to trigger cashflow diversion.
- CLOs are not forced to sell loans: If CCC balances rise, CLO managers may actively elect to sell based on a credit decision (the potential for the credit quality of the loans to deteriorate further). If no action is taken and the CCC balance climbs to a sufficiently high level, the CLO’s protections will automatically kick-in and guard CLO debt investors by redirecting cashflows from the equity to the AAA investor.
The CCC excess is a little complicated and that unfortunately can create confusion when generalists comment or write about it in the press. However, for those willing to take time to understand the dynamics, it becomes clear that the CCC excess is not a forced liquidation trigger but rather a pre-emptive measure aimed at offering additional protection to CLO debtholders. They will also see how these tests protect CLO investors and have resulted in the robust credit performance observed over the last 25 years.
Endnotes
- S&P’s, “Default, Transition, and Recovery: 2023 Annual Global Leveraged Loan CLO Default And Rating Transition Study”, 10-year time horizon, 27-Jun-24.
- Fair Oaks Capital as at 09-May-25. Illustrative example using Trinitas Euro 9 CLO. Analysis assumes CCC trading price of 50c.