The DESK
05-Jun-25The trillion behind the ticker
03-Jul-25The DESK
05-Jun-25The trillion behind the ticker
03-Jul-25Insights
Finding liquidity at the core

Barry Povey
Principal
Rethinking traditional liquidity analysis for CLO ETFs
Investors are familiar with understanding the liquidity of a specific asset by looking at secondary market activity. Measures such as ‘average daily trading volume’ or ‘available free float’ are typical examples of traditional analytical approaches.
While this is appropriate for assets with no active primary market (e.g., shares in a company), traditional analysis is incomplete for ETFs where an active primary market does exist. In the case of European CLO ETFs, liquidity is driven by the liquidity of the underlying asset itself – AAA CLOs.
We show that because AAA CLOs are liquid and CLO ETFs provide a way of accessing this liquidity at minimal cost, AAA CLO ETFs are currently far more liquid than traditional measures might suggest.
Introduction
A question we are frequently asked is how an investor should approach understanding the liquidity and bid-offer spreads of CLO ETFs. Given the product is relatively new and its ease of trading is often highlighted as a key benefit, this question is to be expected. A natural place to start is by analysing the activity in secondary markets by using measures such as ‘average daily trading volumes’ or available ‘free float’. However, this neglects a vital feature of ETFs. ETFs have an active primary market which can be accessed daily by investors. The simplicity of this access sets the foundation for the liquidity in any ETF product.
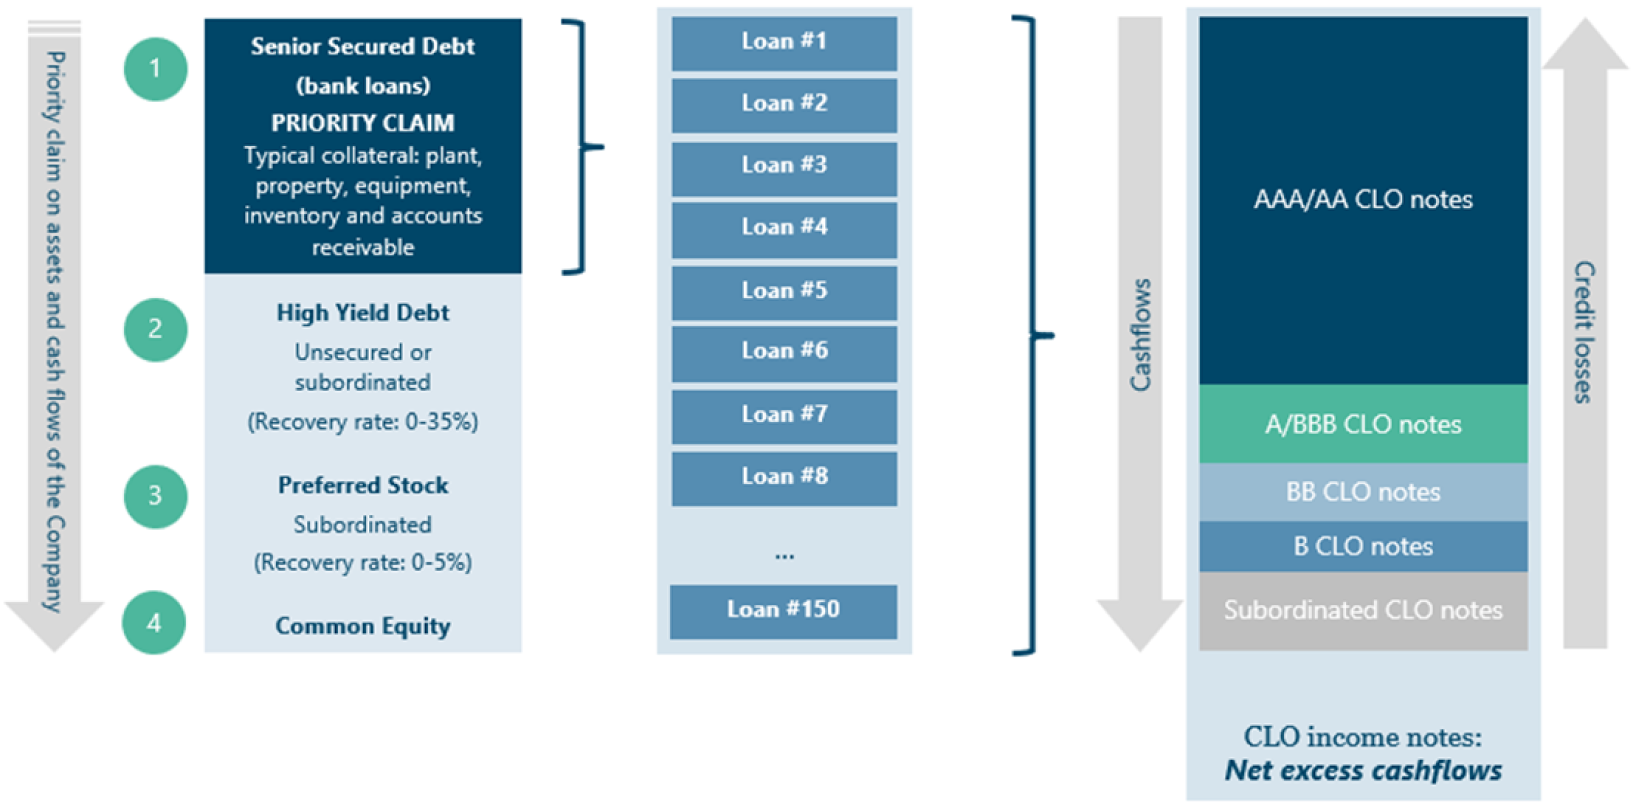
The structural tests maintained by CLOs
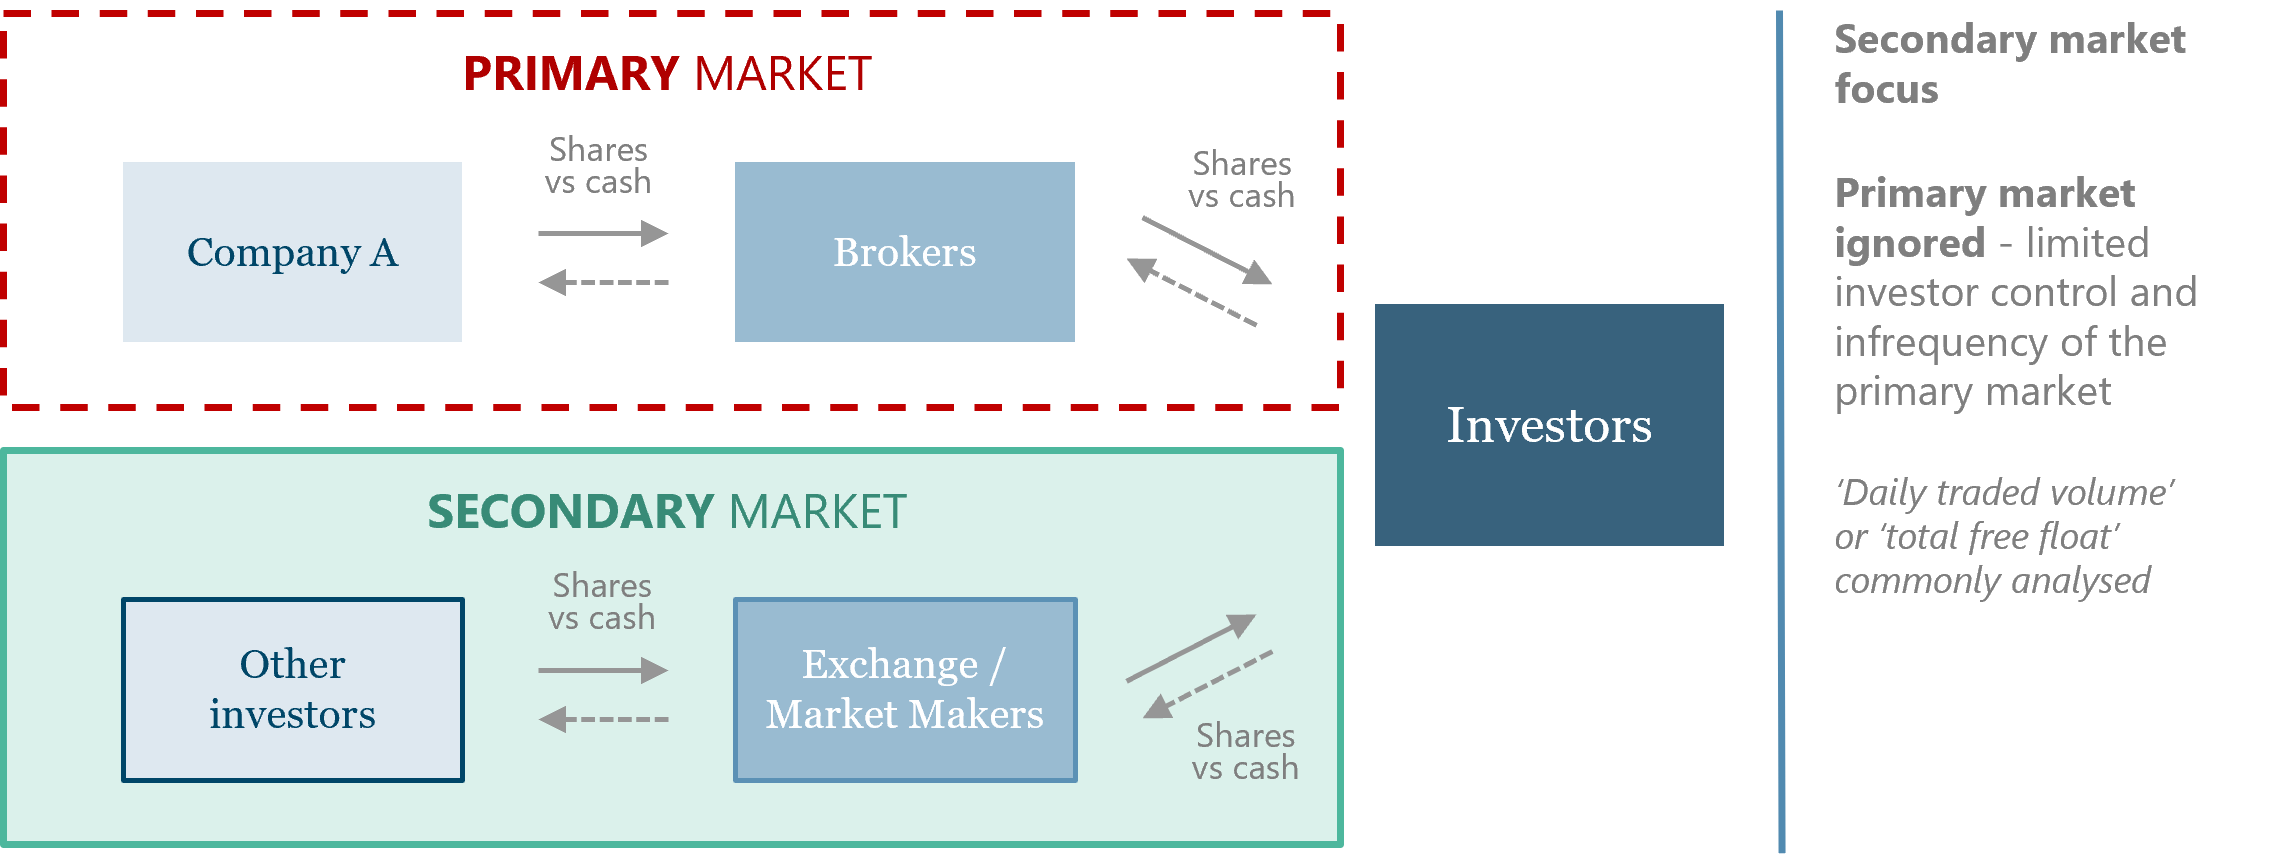
The majority of investors understand how to evaluate the liquidity of a company’s shares, along with the roles played by the two markets that facilitate it (the primary and secondary markets). The secondary market, in particular, is often the focus of analysis as it is the most easily accessible, daily method for transacting in a company’s shares.
An investor can approach a broker or market maker to buy or sell shares. A broker would then seek the opposite side of the investor’s trade (i.e., if the investor wanted to sell, the broker would source a buyer) and charge a small fee for intermediating. This is commonly executed through the secondary market by transacting with the exchange (an organised meeting place of buyers and sellers). A market maker acts in a similar capacity; however, they will also buy or sell shares for their own account or inventory. If the investor wanted to sell the shares, the market-maker can buy them to hold temporarily and, over time, look to sell the shares on to another investor. Market makers are exposed to any profit or loss while owning the shares and typically charge a bid-offer spread for this action.
The primary market also exists for the purchase and sale of company shares. Examples of such primary activities are initial public offerings (“IPOs”), where shares are initially sold to the market, or a rights issue, where exiting shareholders are given the chance to buy additional shares. However, given these often only take place at the direction of the company and do not occur daily, investors do not typically factor them into liquidity analysis. As a result, investors focus on the secondary activity in a company’s shares, such as the bid-offer spread, or fees charged for transacting with a broker or market maker. ‘Market capitalisation’ (the total value or shares outstanding in a company) or ‘free float’ (the value of those shares freely available to trade) may also be compared to a potential investment size to gauge the likelihood of successfully transacting in the shares.
For example, if an investor wanted to invest $10mm in a company with a $100bn free float, it is highly likely the brokers would be able to source the other side of the trade and facilitate it with minimal cost. If, however, the company only had a free float of $50mm, it may be trickier to find a buyer. Another way to consider this would be to compare the potential investment size to the average daily traded volume on the exchange. If the potential investment is a small percentage, there would be minimal concern with regard to liquidity.
1. Traditional liquidity analysis: secondary only
ETF liquidity analysis
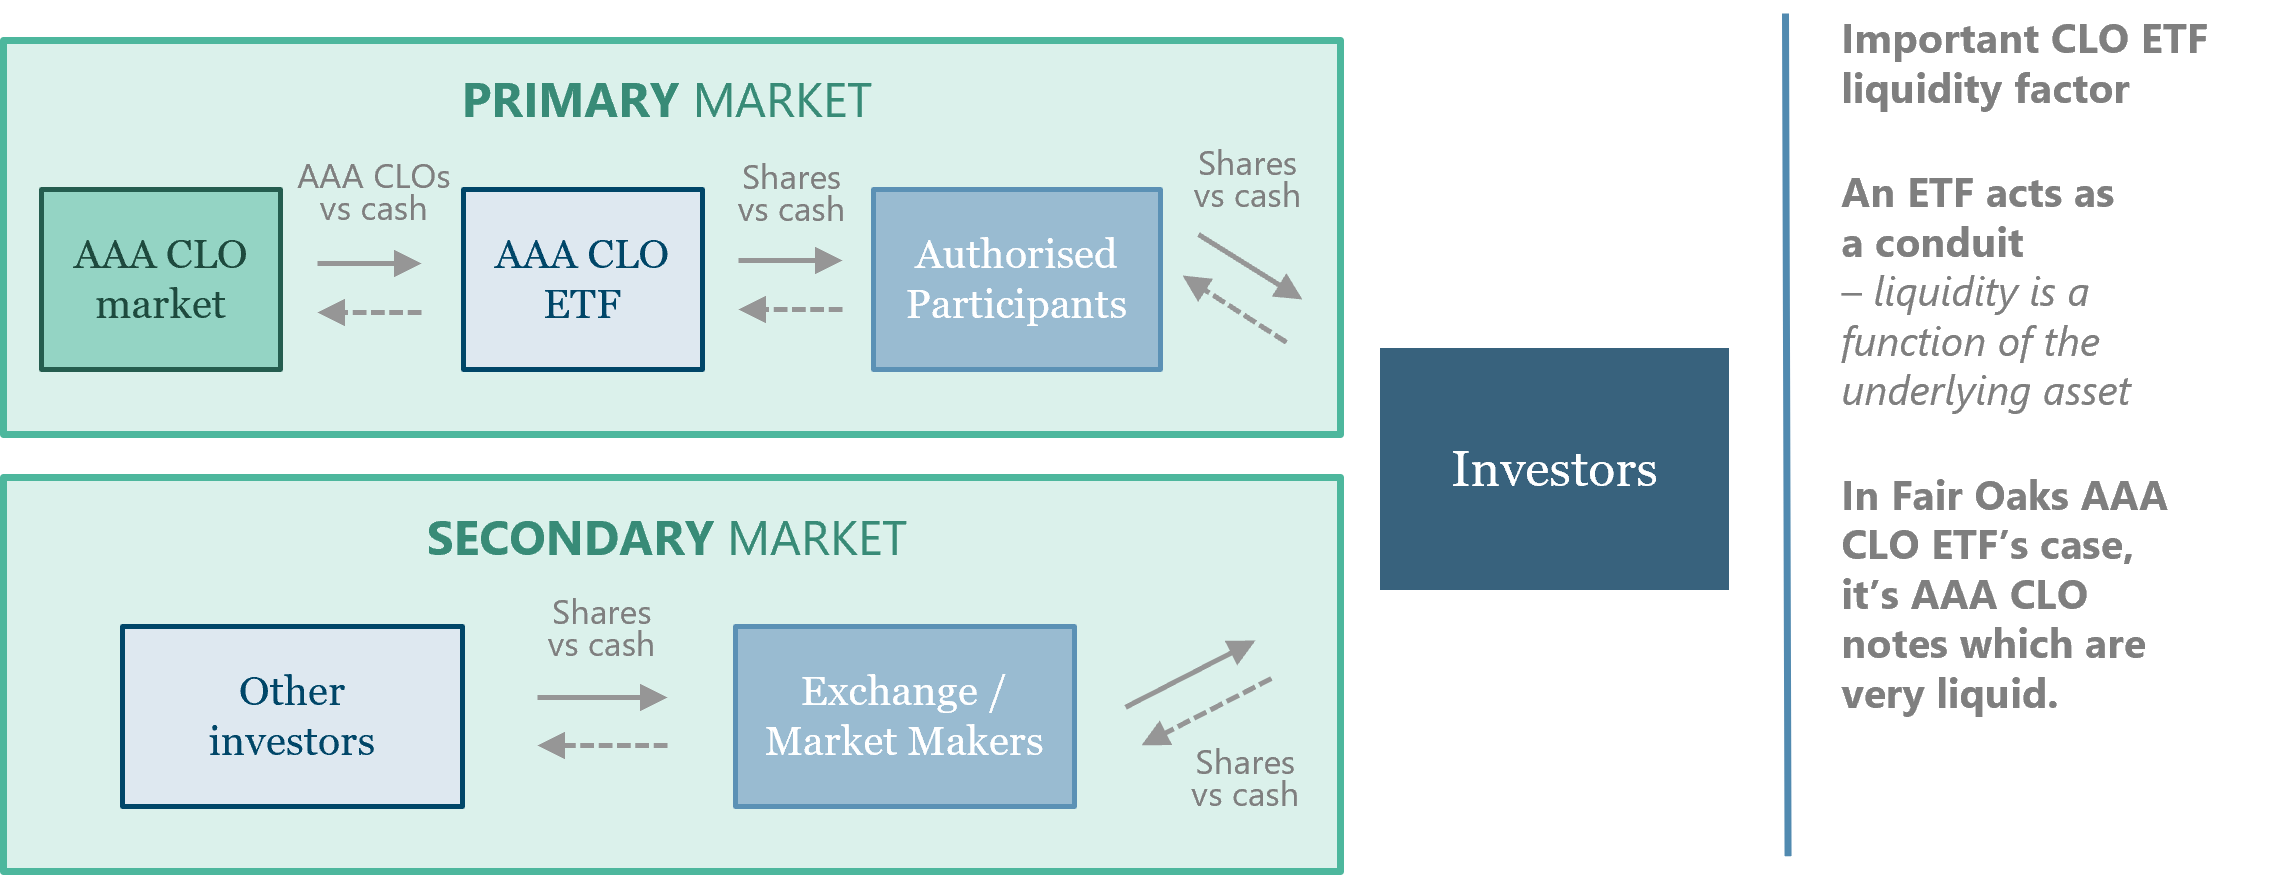
In many ways, the underlying concepts of ETF liquidity are similar. However, applying traditional secondary-focused liquidity analysis misses a key feature of ETFs. Unlike corporate shares, ETFs have an easily accessible, daily primary market. Institutional investors may approach an Authorised Participant (“AP”) and request the creation (purchase) or redemption (sale) of ETF shares in the primary market. In the case of a creation, the investor provides cash to the AP and receive ETF shares in return. The cash is received by the ETF and the investment manager then uses it to purchase new assets. In the case of a redemption, the investor returns the shares to the AP and receives cash in return. This cash is funded by selling a portion of the fund’s assets. In both cases, there is no need for the AP to source the other side of the trade as the liquidity is generated through directly transacting with the fund, i.e., the ability of the fund to buy or sell the underlying assets. Therefore, the core driver of liquidity is not the ETF market but rather the liquidity available in the underlying asset market (in this case, AAA CLOs).
2. ETF liquidity analysis: primary and secondary
There are two components to the price and costs of a transaction:
-
- ETF price and charge: shares are typically created and redeemed at NAV (“net asset value” i.e., the market value of the underlying assets). Typically ETFs charge an additional creation or redemption fee on top, however the Fair Oaks AAA CLO ETF is ‘NAV flat’, meaning only the market value of the underlying CLOs is charged. This market value is independently calculated by third party valuation services.
- AP charge: the transaction type determines the charged amount
-
- If a CLO ETF investor wants to trade immediately, the AP will quote a price with a bid-offer (most likely less than 20bps for CLO ETFs and usually significantly tighter) and the trade is completed immediately. This price could vary slightly to the NAV and would reflect the market maker’s view at the time of the trade.
- If an order is left with the AP to create or redeem at the end of the day, a small spread on top of the official NAV will be charged (e.g. an all-in price of NAV +/- approximately 3bps for CLO ETFs).
-
It is worth considering how significantly this alters traditional liquidity analysis. As the primary market has daily activity and low cost, analysing the liquidity of ETFs by only evaluating secondary measures such as the average daily volume trade or free float of the ETF misses a key point: it is also a function of the underlying asset’s liquidity.
A framework by which to consider ETF liquidity could follow:
-
- How liquid is the underlying asset, and what are the costs of transacting in it? This sets the core liquidity, as this is what the primary market of the ETF is accessing. Then, the costs of ETF share creation or redemption, and the AP bid-offer or costs are added (approximately 2-12bps for CLO ETFs under normal market conditions).
- An active secondary market in ETF shares can further tighten pricing, although it is not essential for ensuring liquidity when creating or redeeming shares.
ETF liquidity analysis
In Fair Oaks’ view, AAA CLOs are very liquid. They are actively traded in size on a daily basis in the secondary markets. Average monthly auction volumes were €485mm in 2024 (with four months above €600mm).1 We have previously discussed, in our “The CLO Investor Series” (Issue 3, April 2025), the number of investors who discovered AAA CLOs to be a vital asset class during periods of volatility due to the ability to sell in size with limited discount. Such spikes in AAA CLO trading volume were observed in COVID (€1.1bn in March 2020), LDI (€1bn in Oct 2022) and the recent tariff related volatility (€890mm in April 2025).1 The liquidity is underpinned by a large and broad investor base, from the world’s largest banks and insurance companies to specialist asset managers.
Additionally, the cost of trading AAA CLOs is minimal – often 0.02% on cash price. On the CLO primary side, €49bn volume printed in 2024, of which AAA’s were roughly 60% - an average monthly run rate of €2.5bn.1 AAA CLO ETFs merely provide a conduit for accessing this pool of liquidity.
Putting it all together: AAA CLO ETF Liquidity
As established, ETFs can benefit from secondary activity but are also able to access the liquidity of the primary market. Therefore, ETF liquidity is not necessarily a function of the average traded volume or its AUM, but rather the liquidity of the underlying assets. In the case of AAA CLOs, the market is large, active and can be transacted in at minimal cost. In assessing the liquidity of a proposed AAA CLO ETF investment, one should first consider it in relation to the size of the underlying AAA CLO market.
In context, suppose an investor wanted to invest €50mm into the Fair Oaks AAA CLO ETF. The total global amount of AAA CLOs currently outstanding in the market is €693bn.1,2
In ‘flow’ terms, the average monthly primary volume for European AAAs in 2024 was approximately €2.5bn (not including refinancing’s and resets, which would add another €1.5bn, approximately),1 and the average secondary auction volume was €485mm, not counting any bilateral trading. Dealers also hold a meaningful inventory, and it is normal for each active dealer to have over €20mm offered on their runs (often with larger sizes not listed).
As an example, on the day of writing this, Fair Oaks counts at least 11 dealers with more than €20mm of AAA inventory on offer each.2 Therefore, if an institutional investor wanted to invest €50mm into the ETF, they would approach an AP who could execute the trade at end of day NAV (with no added fees charged by Fair Oaks) and a small markup from the AP. Fair Oaks would then access the liquidity of the CLO market to deploy the capital in new CLO assets. As always, Fair Oaks would be actively selecting investments based on our usual in-depth investment process and fund constraints.
Conclusion
We believe that by understanding the roll of the primary ETF market, investors can better grasp the true liquidity of CLO ETFs and how those ETFs are able to provide efficient access to the underlying AAA CLO market at minimal cost.
Endnotes
- Bank of America “European CLO Databank - May-25” and Fair Oaks Capital data as at 04-Jun-25.
- Bank of America “CLO Weekly - May-25” and Fair Oaks Capital data as at 04-Jun-25.